# tracexec
A small utility for tracing execve{,at} and pre-exec behavior.
tracexec helps you to figure out what and how programs get executed when you execute a command.
It's useful for debugging build systems, understanding what shell scripts actually do, figuring out what programs
does a proprietary software run, etc.
- [Installation Guide](INSTALL.md)
## Showcases
### TUI mode with pseudo terminal
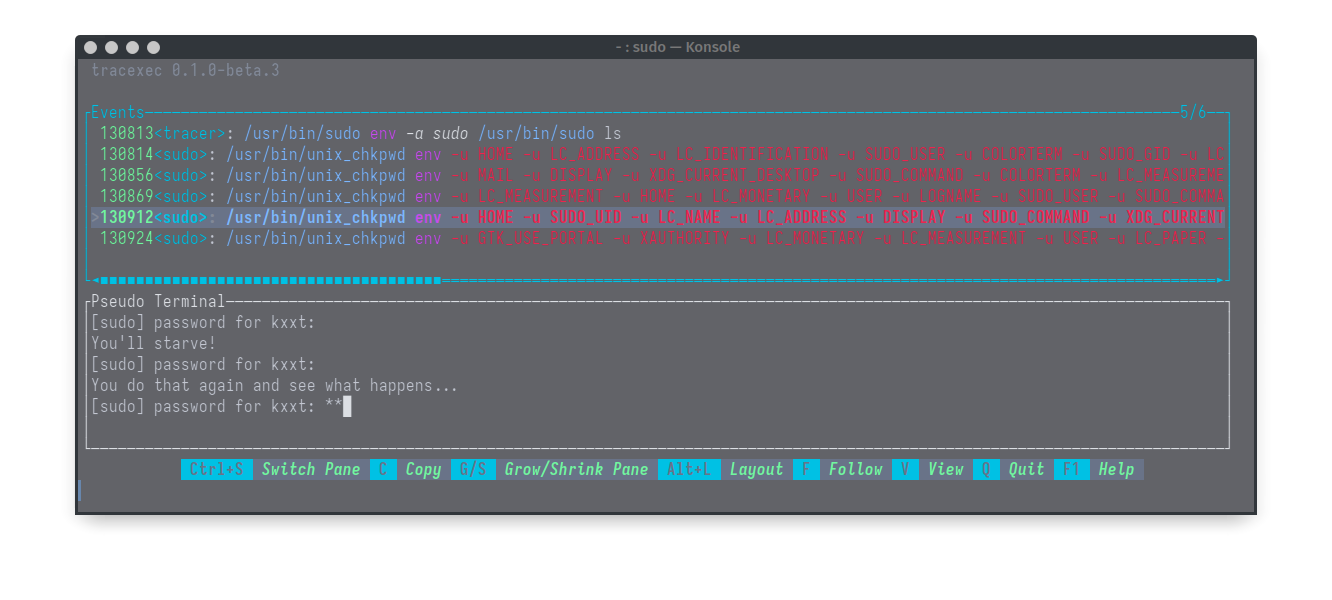
In TUI mode with a pseudo terminal, you can view the details of exec events and interact with the processes
within the pseudo terminal at ease.

### Tracing setuid binaries
With root privileges, you can also trace setuid binaries and see how they work.
But do note that this is not compatible with seccomp-bpf optimization so it is much less performant.
You can use eBPF mode which is more performant in such scenarios.
```
sudo tracexec --user $(whoami) tui -t -- sudo ls
```

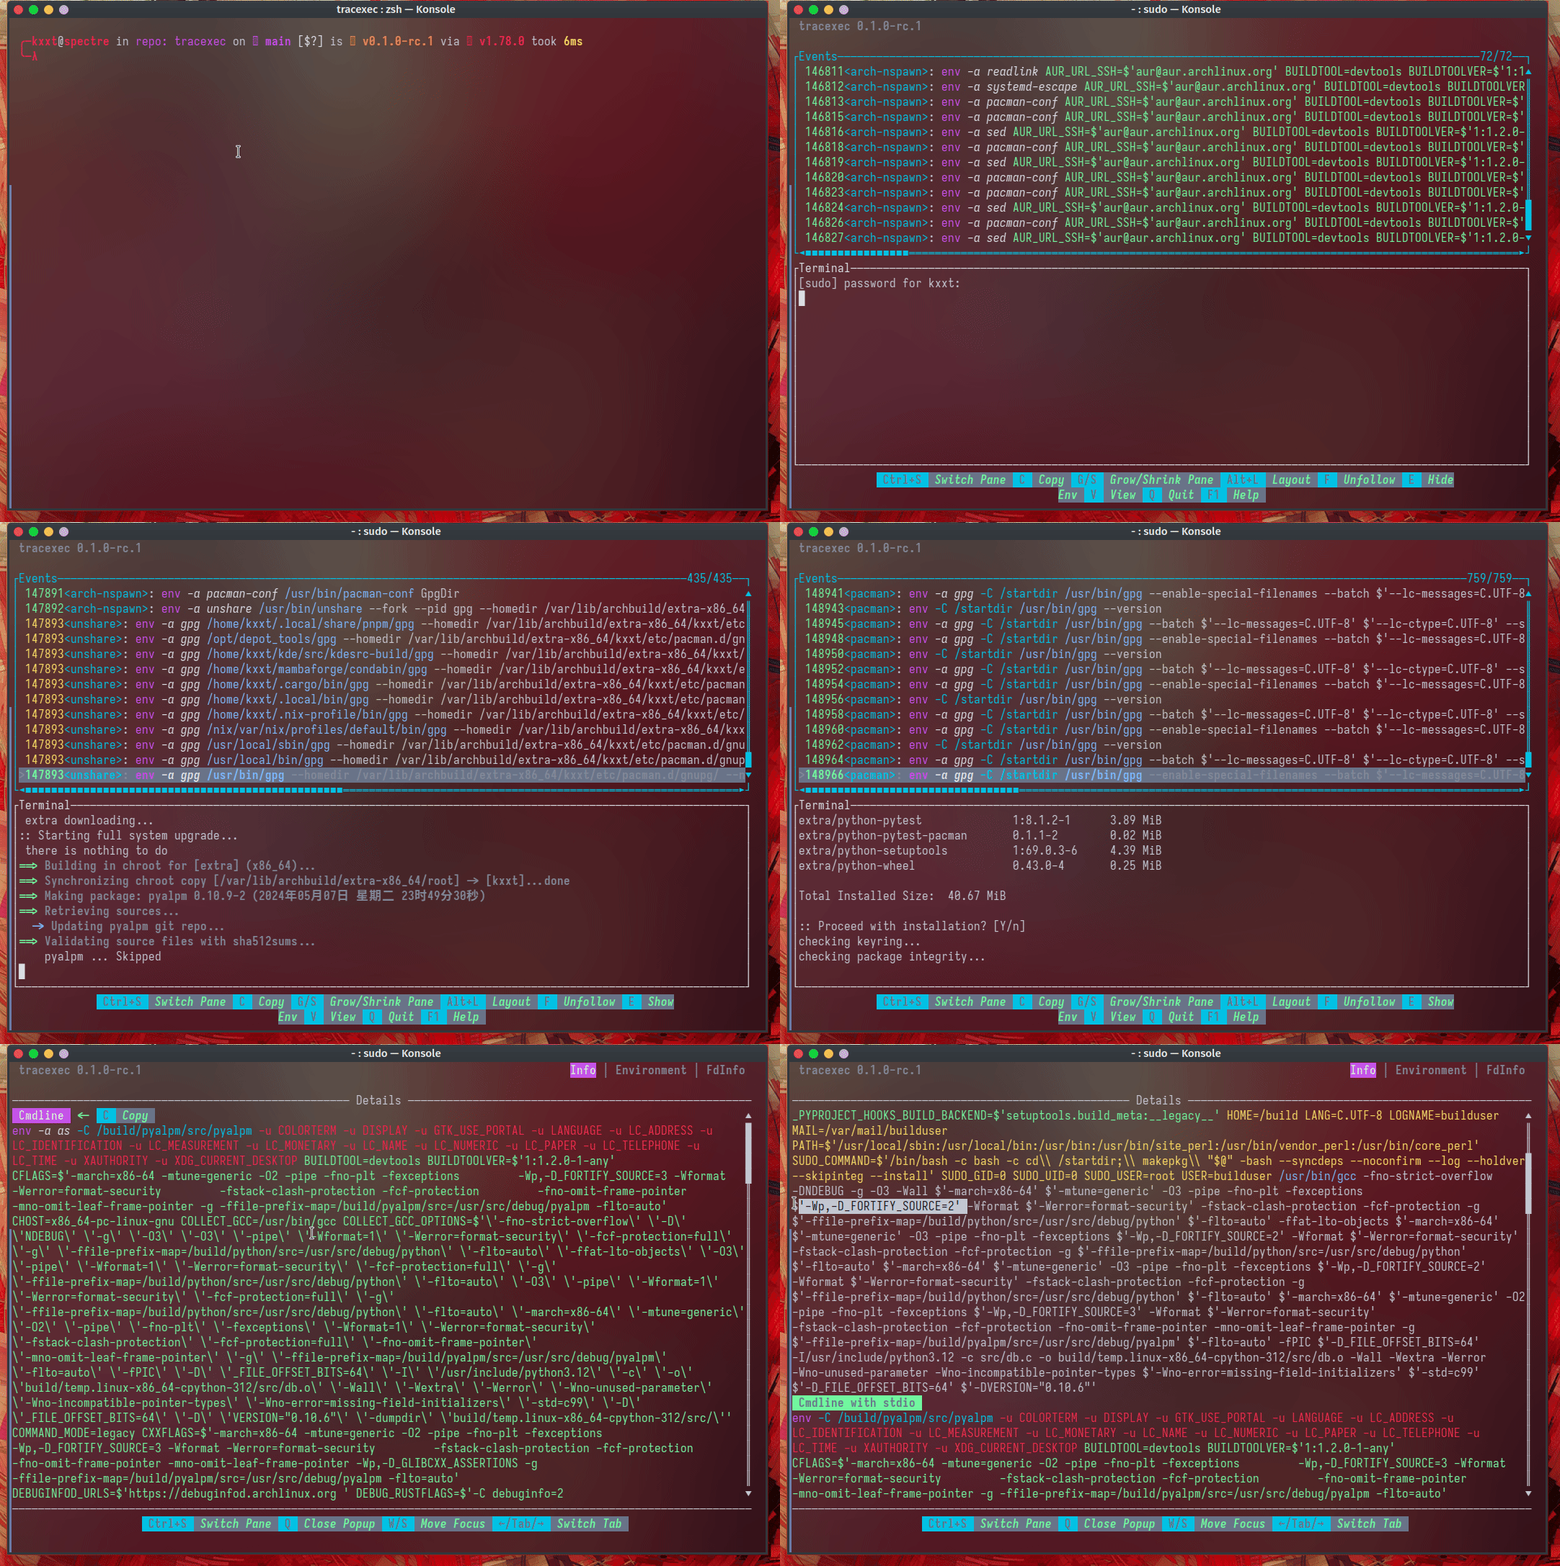
Nested setuid binary tracing is also possible: A real world use case is to trace `extra-x86_64-build`(Arch Linux's build tool that requires sudo):

In this real world example, we can easily see that `_FORTIFY_SOURCE` is redefined from `2` to `3`, which lead to a compiler error.
### Use tracexec as a debugger launcher
tracexec can also be used as a debugger launcher to make debugging programs easier. For example, it's not trivial or convenient
to debug a program executed by a shell/python script(which can use pipes as stdio for the program). The following video shows how to
use tracexec to launch gdb to detach two simple programs piped together by a shell script.
https://github.com/kxxt/tracexec/assets/18085551/72c755a5-0f2f-4bf9-beb9-98c8d6b5e5fd
Please [read the gdb-launcher example](https://github.com/kxxt/tracexec/blob/main/demonstration/gdb-launcher/README.md) for more details.
### eBPF mode
The eBPF mode is currently experimental.
It is known to work on Linux 6.6 lts and 6.10 and probably works on all 6.x kernels.
For kernel versions less than 6.2, you'll need to enable `ebpf-no-rcu-kfuncs` feature.
It won't work on kernel version < 5.17.
The following examples shows how to use eBPF in TUI mode.
The `eBPF` command also supports regular `log` and `collect` subcommands.
#### System-wide Exec Tracing
```bash
sudo -E tracexec ebpf tui
```
[ebpf-system-wide-tui.webm](https://github.com/user-attachments/assets/12cec4ef-8884-4580-a93a-c9144ec7102b)
#### Follow Fork mode with eBPF
```bash
sudo -E tracexec --user $(whoami) ebpf tui -t -- bash
```
[ebpf-follow-forks.webm](https://github.com/user-attachments/assets/997e1992-df85-4d45-ae68-faf693c6b99b)
### Log mode
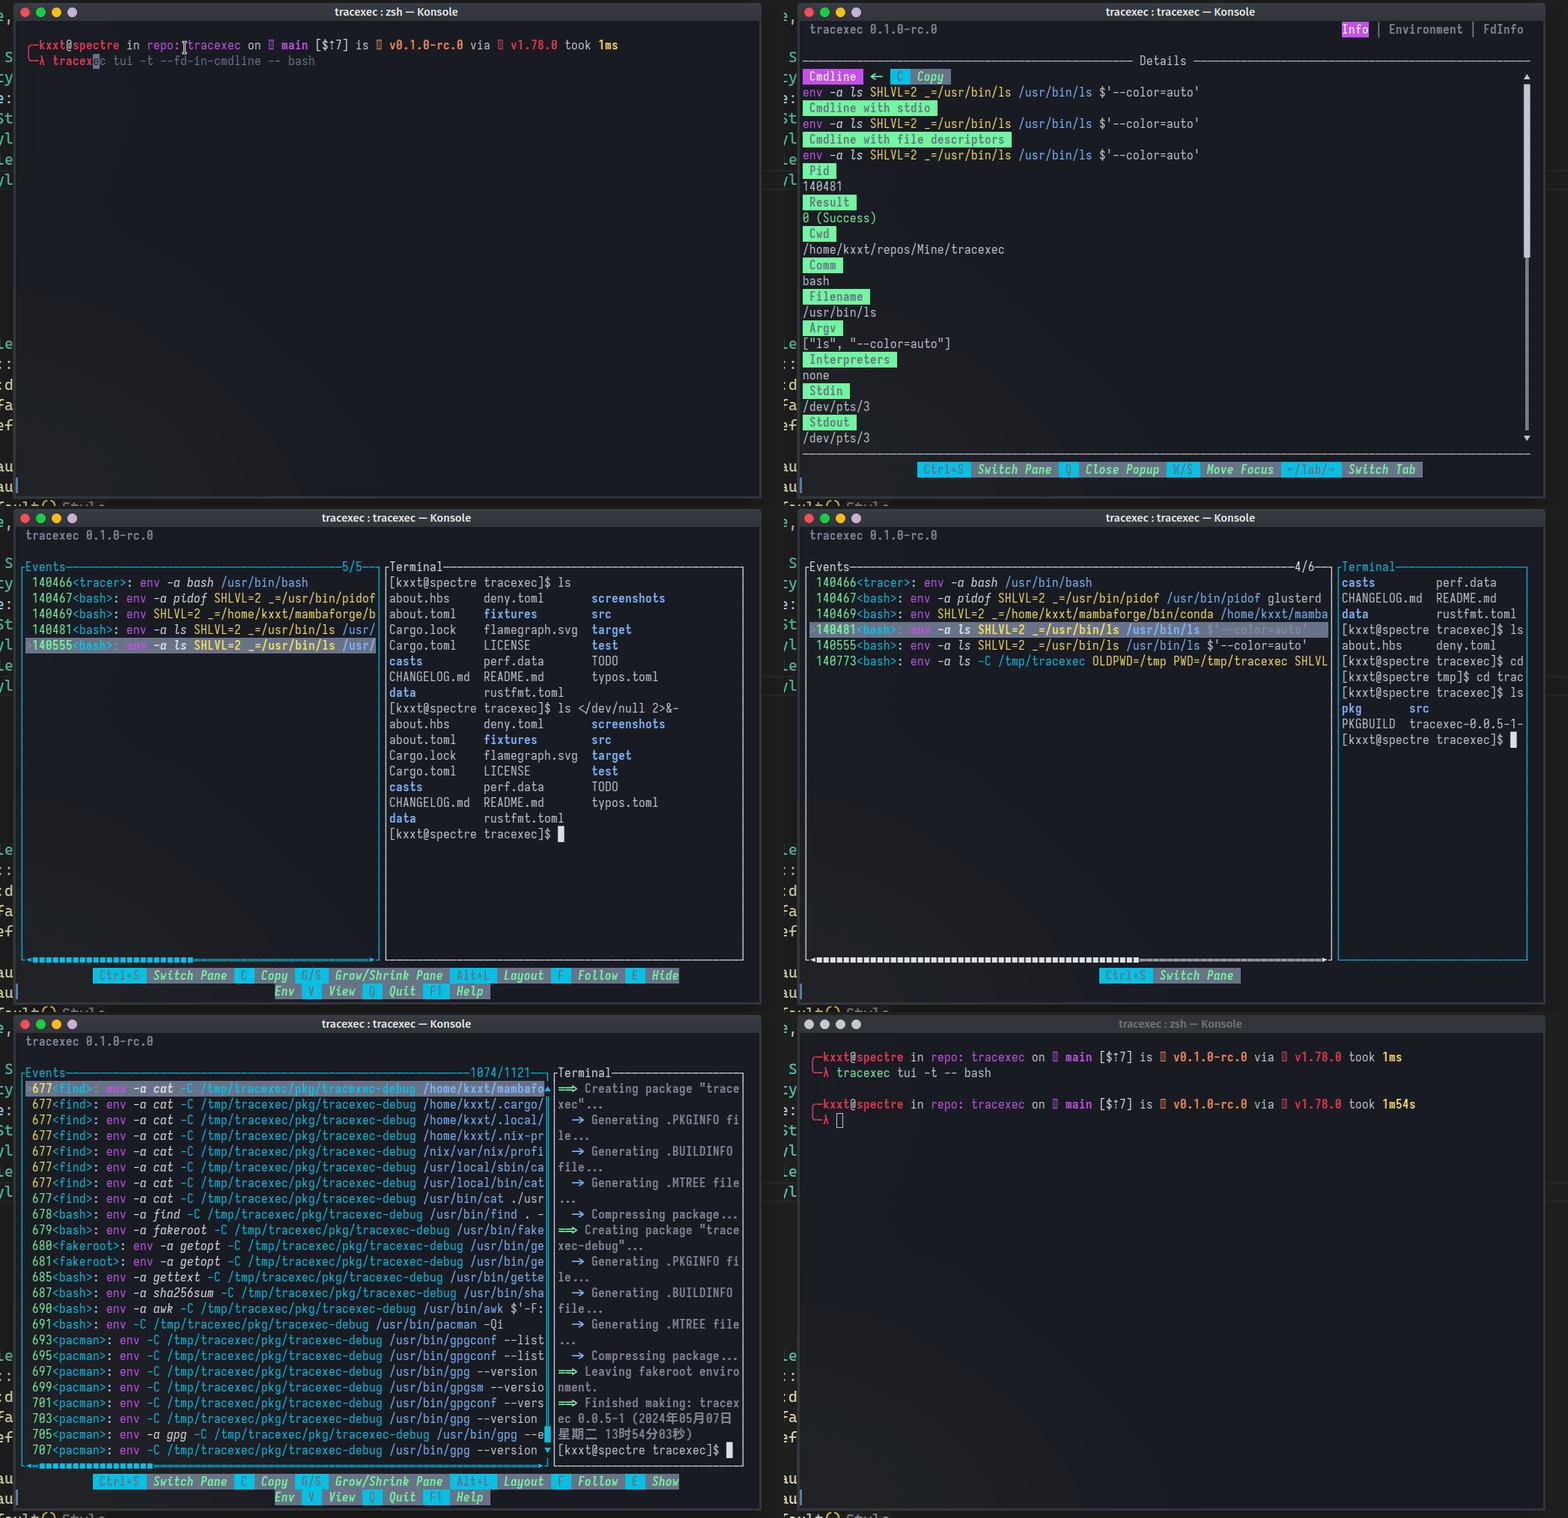
In log mode, by default, `tracexec` will print filename, argv and the diff of the environment variables and file descriptors.
example: `tracexec log -- bash` (In an interactive bash shell)
[](https://asciinema.org/a/sNptWG6De3V5xwUvXJAxWlO3i)
### Reconstruct the command line with `--show-cmdline`
```bash
$ tracexec log --show-cmdline -- <command>
# example:
$ tracexec log --show-cmdline -- firefox
```
[](https://asciinema.org/a/AWTG4iHaFPMcEGCVtqAl44YFW)
### Try to reproduce stdio in the reconstructed command line
`--stdio-in-cmdline` and `--fd-in-cmdline` can be used to reproduce(hopefully) the stdio used by a process.
But do note that the result might be inaccurate when pipes, sockets, etc are involved.
```bash
tracexec log --show-cmdline --stdio-in-cmdline -- bash
```
[](https://asciinema.org/a/NkBTaoNHS7P7bolO0hNuRwGlQ)
### Show the interpreter indicated by shebang with `--show-interpreter`
And show the cwd with `--show-cwd`.
```bash
$ tracexec log --show-interpreter --show-cwd -- <command>
# example: Running Arch Linux makepkg
$ tracexec log --show-interpreter --show-cwd -- makepkg -f
```
[](https://asciinema.org/a/7jDtrlNRx5XUnDXeDBsMRj09p)
## Usage
General CLI help:
```bash
%{general}
```
TUI Mode:
```bash
%{tui}
```
Log Mode:
```bash
%{log}
```
Collect and export data:
```
%{collect}
```
eBPF backend supports similar commands:
```
%{ebpf}
```
## Profile
`tracexec` can be configured with a profile file. The profile file is a toml file that can be used to set fallback options.
The profile file should be placed at `$XDG_CONFIG_HOME/tracexec/` or `$HOME/.config/tracexec/` and named `config.toml`.
A template profile file can be found at https://github.com/kxxt/tracexec/blob/main/config.toml
As a warning, the profile format is not stable yet and may change in the future. You may need to update your profile file when upgrading tracexec.
## Known issues
- Non UTF-8 strings are converted to UTF-8 in a lossy way, which means that the output may be inaccurate.
- For eBPF backend, it might be impossible to show some details of the tracee, See https://mozillazg.com/2024/03/ebpf-tracepoint-syscalls-sys-enter-execve-can-not-get-filename-argv-values-case-en.html
- The output is not stable yet, which means that the output may change in the future.
- Test coverage is not good enough.
- The pseudo terminal can't pass through certain key combinations and terminal features.
## Origin
This project was born out of the need to trace the execution of programs.
Initially I simply use `strace -Y -f -qqq -s99999 -e trace=execve,execveat <command>`.
But the output is still too verbose so that's why I created this project.
## Credits
This project takes inspiration from [strace](https://strace.io/) and [lurk](https://github.com/JakWai01/lurk).